This has been a difficult problem to solve. Thankfully I asked about it on time. I’m working with solar images observed by a ground-based telescope in US. For a while I’ve been thinking there was something wrong with the data, for a start my images didn’t look like the ones that appeared in papers, mine looked saturated on certain areas.
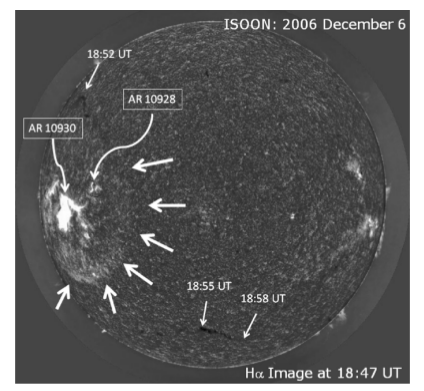
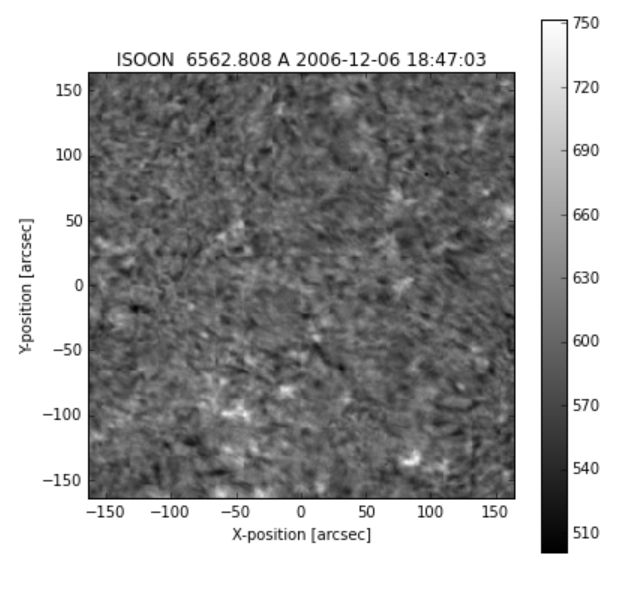
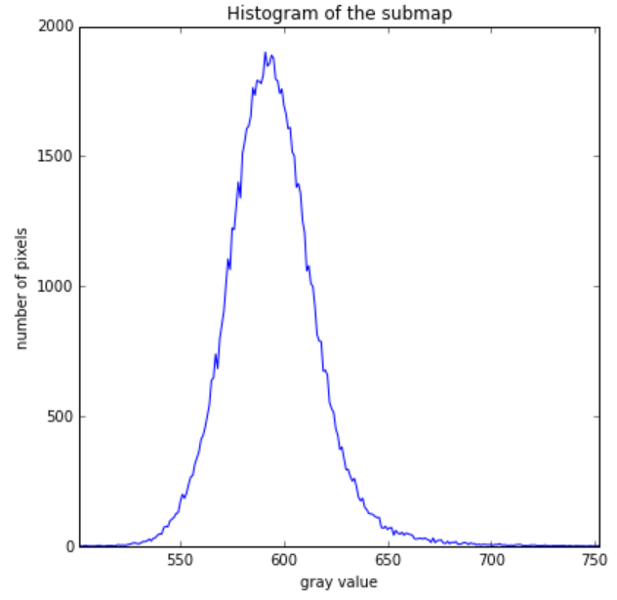
This is the original figure from the paper:
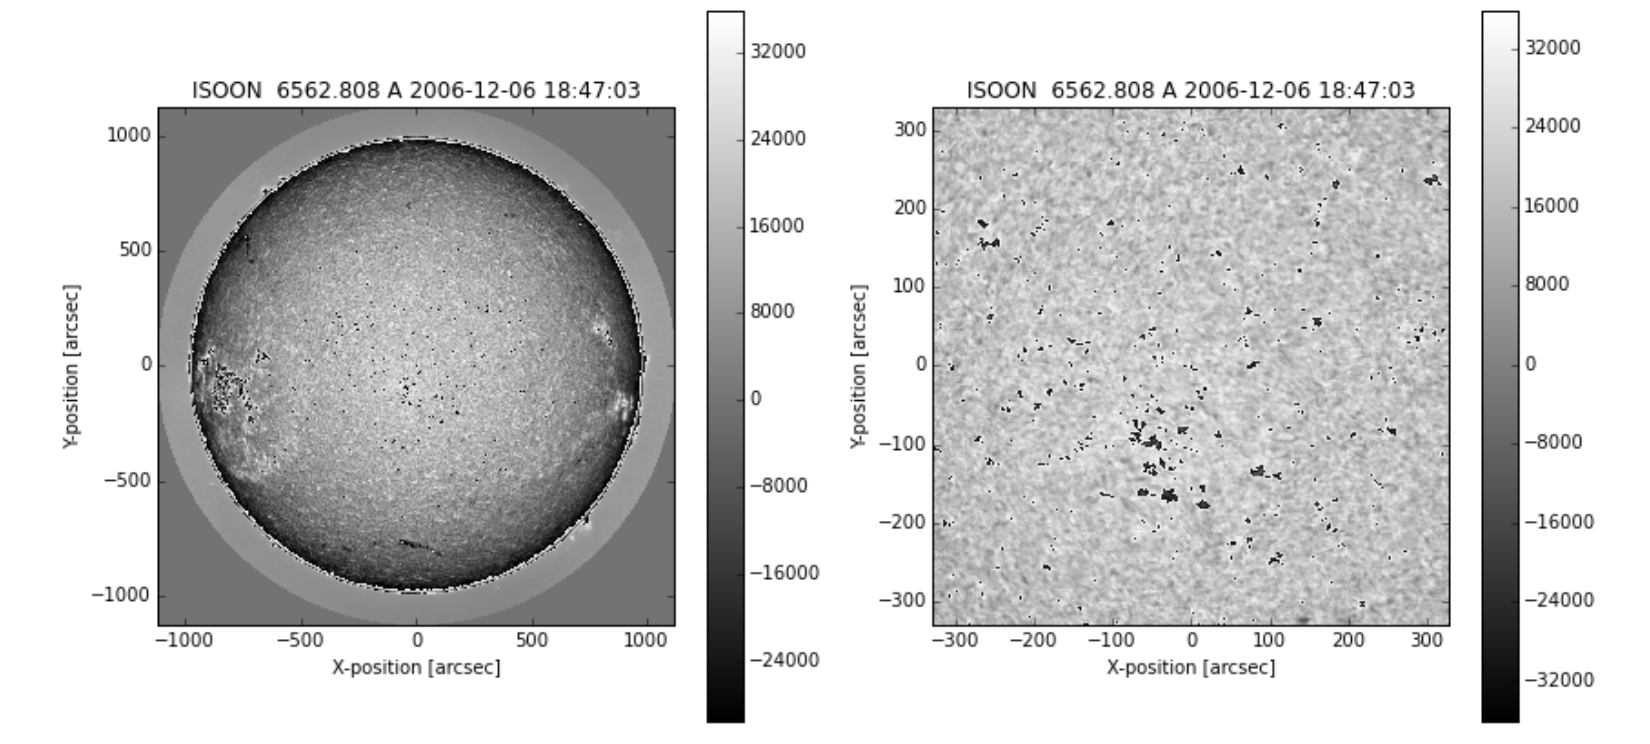
And this is how it looked when I opened them:
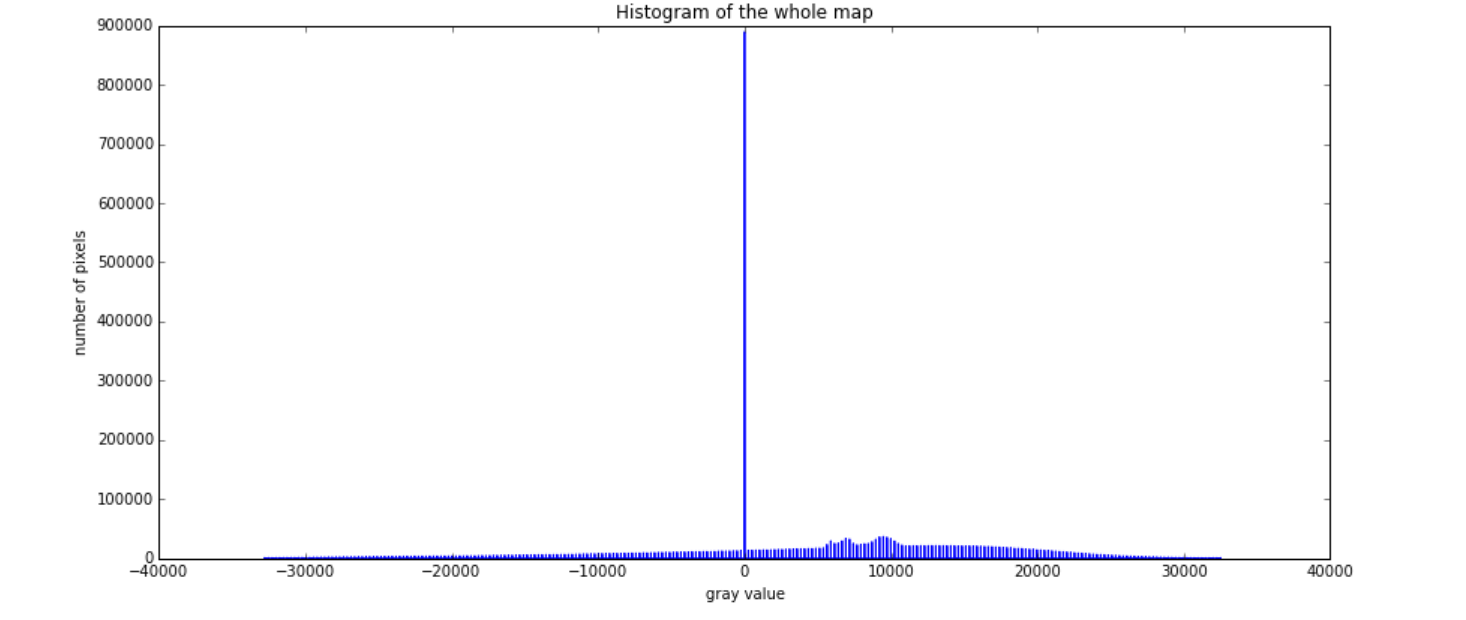
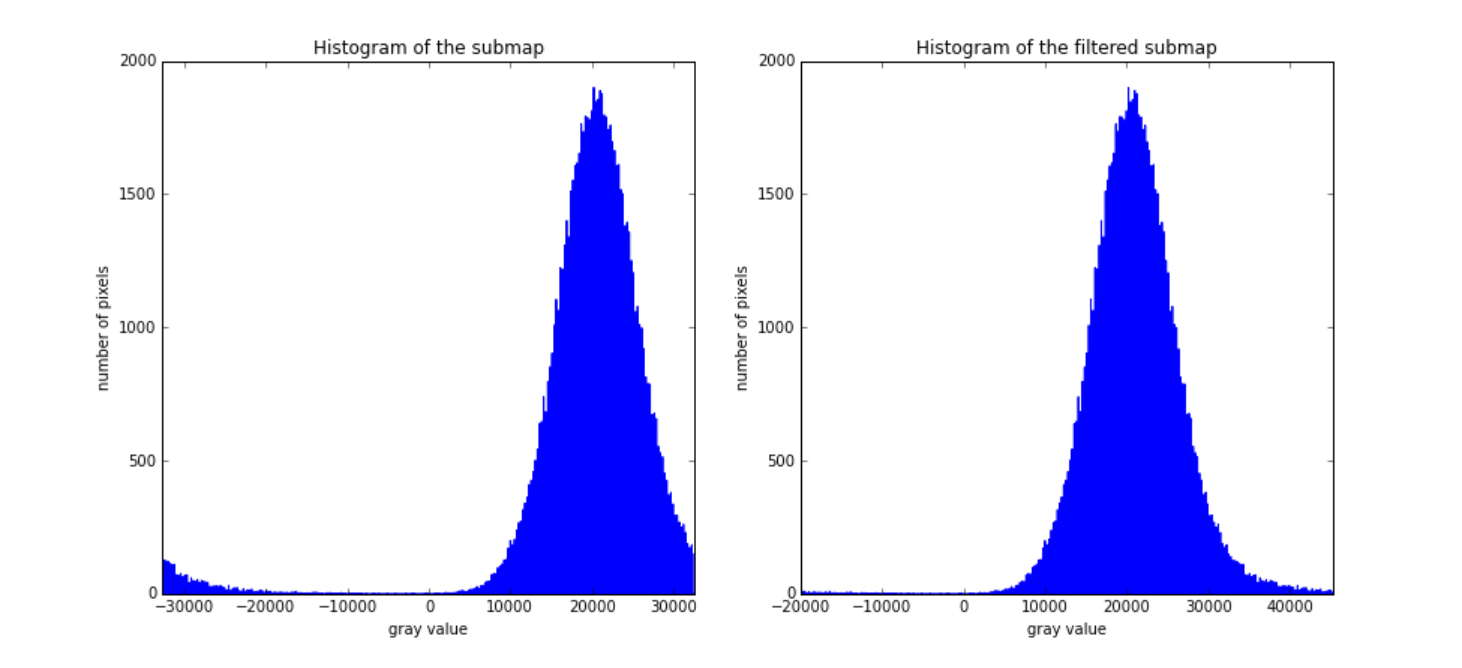
I went over this few times, and my first attempt is to look at the histogram, just to get an idea of the distribution of the data (and be able to choose a sensible min and max to plot). The histogram looked weird too… too discrete… Oh yes, they are integers - fair enough… but why are there negative numbers?
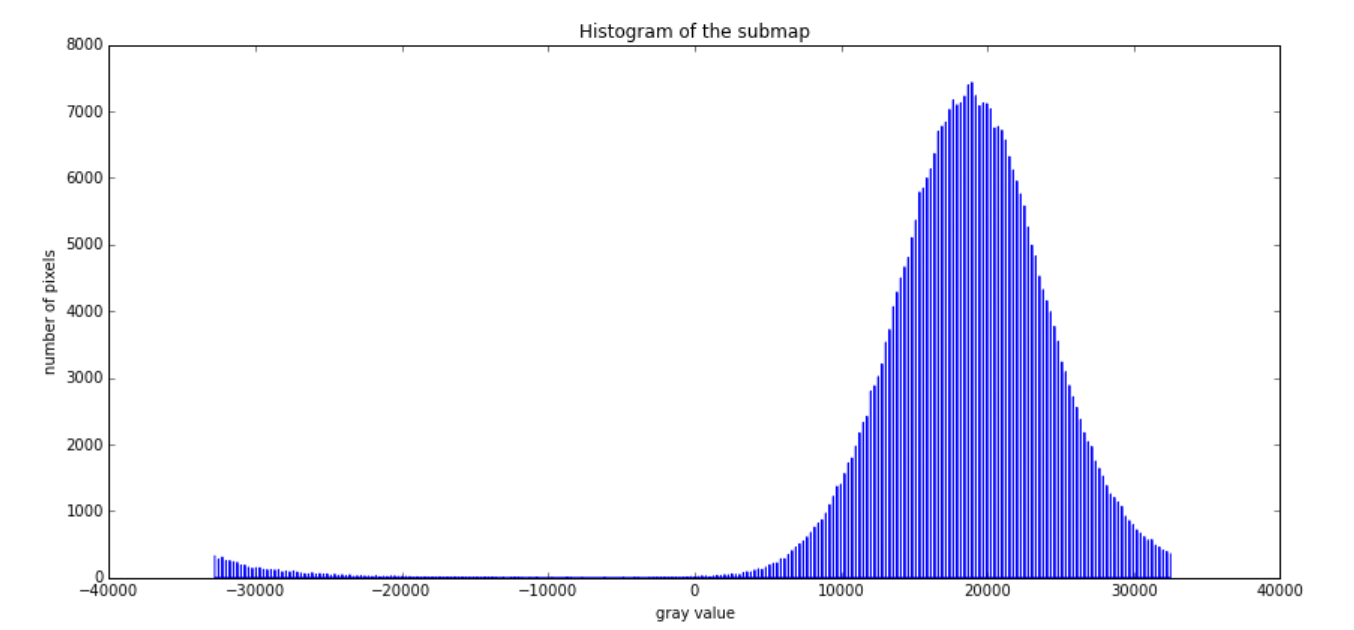
Last week, while telling to my colleague how the image and the histogram look, also for a small portion of the image…
I got an idea, the numbers are overfloating, look at the begining of the histogram, looks like it should be the tail. So, I started to move the negative to the positive by just:
def
    image[image < 30000] +=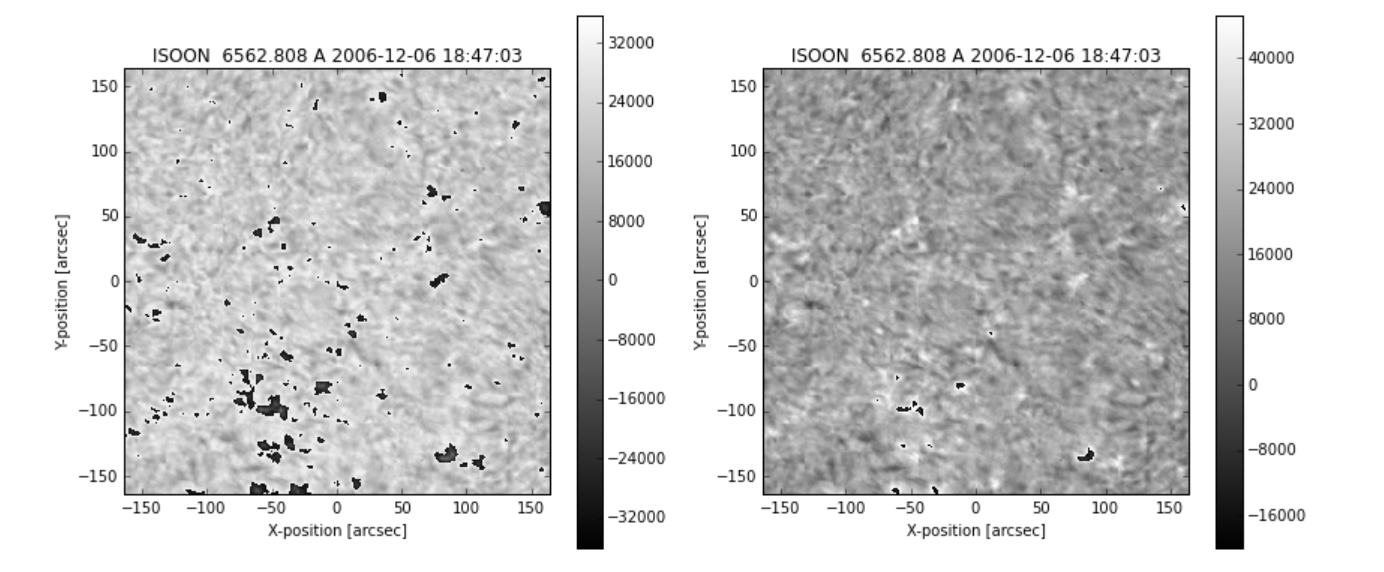
… but still, it didn’t look right. Some places look better, so for sure it was not saturated. However, other parts were still looking wrong, as it some limb darkening correction was applied inversely.
Then I asked for help to the people of the telescope… and I got a very enlighten replied:
Depending on the OS you might have to first do a Byteorder.
The IDL docummentation about it didn’t helped much to make me understand, but Coyote’s explanation helped much more. However, it confused me when it says:
“Most UNIX machines are big endian. Whereas most PCs are little endian machines.”
Thankfully, the test shown on its page showed me that our “linux” servers at work are little and not big.
So, what does this mean? It seems that some machines stores a two byte integer number in a different way than others (why? who knows!). So for example: 10405 in binary is
- 00101000 10100101 for a little endian machine (as if you would have written it by hand)
- 10100101 00101000 for a big endian one.
I don’t really know yet - and haven’t come up with a way to check it is the following statement:
Big endian machines store a two-byte integer with its most significant byte first, followed by it least significant byte.
Does this mean that just that in the case above, we put first the larger one? so, if we convert the numbers to decimal:
>>> print('{:d}'.format(0b00101000))
'40'
>>> print('{:d}'.format(0b10100101))
'165'
or by asking wolfram alpha
- 00101000 = 40
- 10100101 = 165
then we get:
- 165 - 40 for big endian
- 40 - 165 for little endian
Is that right? If so, the numbers that I would have read would be:
- 42280 instead of 10405
I still have not got it clear in my mind whether the largest one of the two sets goes first, or that does not matter at all, and by more significant byte it means the first byte and not it values (that makes more sense).
Anyway, the command to solve this in IDL is:
mreadfits, fitsfile, index, data
; network(host) refers to Big(little) endians
byteorder, data, /NtoHs ; ISOON data is in long endian (network) mode
data = float(data)      ; convert it into float
and in numpy:
swaped_data = data.byteswap()So, comming back to my original image and histogram, here is how they look now:
Something new learnt this week!
